
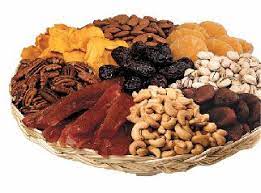
This glycemic index food chart sticks to sweet things: eight Thai desserts, four fruit juices sold in Thailand and five varieties of dates. All three studies used 50 g of glucose as the reference, scored at 100. All three call 55 or under low and 56 to 69 medium, and the dessert and dates papers call 70 or over high.
GI compares the rise in blood glucose after a food with the rise after glucose, for the same amount of available carbohydrate. Glycemic load (GL) adds the serving size, so it is given here where the authors give it.
Chart 1: eight Thai desserts
A Chulalongkorn University team tested desserts picked from a list of well-known regional sweets. Each volunteer ate a portion holding 50 g of available carbohydrate (Namjud and colleagues, 2024, PubMed ID 39539376). There were 96 healthy volunteers, split into eight groups of 12, and each person tested only one dessert. So every row below comes from a different group of people.
| Dessert | Grams eaten in the test | GI | Band | Standard serving | GL per standard serving |
|---|---|---|---|---|---|
| Phetchaburi's Custard Cake | 192.2 | 53.4 | Low | 140 g | 19.5 |
| Saraburi's Curry Puff | 97.9 | 61.8 | Medium | 30 g | 9.5 |
| Nakhon Sawan's Mochi | 80.0 | 68.9 | Medium | 40 g | 17.2 |
| Suphan Buri's Sponge Cake | 117.5 | 75.9 | High | 30 g | 9.7 |
| Ayutthaya's Cotton Candy | 89.2 | 81.4 | High | 40 g | 18.3 |
| Prachuap Khiri Khan's Pineapple Cheese Cake Biscuit | 67.1 | 87.4 | High | 40 g | 26.0 |
| Chon Buri's Bamboo Sticky Rice | 126.2 | 109.3 | High | 80 g | 34.6 |
| Lampang's Crispy Rice Cracker | 68.2 | 149.3 | High | 40 g | 43.8 |
Two results stand out. The custard cake had the lowest GI, yet a 50 g carbohydrate portion of it weighed 192 g, almost three times the 68 g of crispy rice cracker. And two desserts scored above 100, which means they raised blood glucose more than the glucose drink did. The rice cracker reached 149.3.
The GL column uses the authors' standard serving sizes, which are much smaller than the test portions. On those servings the GL runs from 9.5 for the curry puff to 43.8 for the rice cracker.
Chart 2: four fruit juices
A second Chulalongkorn team tested four juices that were on sale in Thailand, all of the Malee brand (Visuthranukul and colleagues, 2022, PubMed ID 35227323). Twelve healthy adults, 7 women and 5 men, drank glucose twice and each juice once, in random order. The project was funded by Malee Samphran Public Company Limited, which is worth keeping in mind when you read it.
| Juice | GI | Band given by the authors | GL per 200 mL |
|---|---|---|---|
| Tangerine orange juice | 34.1 | Low | 8.1 |
| Florida orange juice | 51.3 | Low | 13.0 |
| Blackcurrant mixed juice | 63.0 | Medium | 14.7 |
| Veggie V9 orange carrot | 69.6 | Medium | 12.4 |
The spread between people was wide. The Veggie V9 figure is 69.6 with a standard deviation of 43.3. The authors found that juices with more fructose relative to glucose had lower GI values, and that fibre content did not track GI.
Volume matters for juice. A 200 mL glass of the Florida orange juice holds 25.4 g of available carbohydrate, so the 50 g test dose works out at about 394 mL. For Veggie V9, at 17.8 g per 200 mL, it is about 562 mL.
Chart 3: five varieties of dates
A UAE study tested five date varieties popular in the UAE, all tamer-stage dates from the same batches, from a date factory in Al Ain (Alkaabi and colleagues, 2011, PubMed ID 21619670). The figures below are for the 13 healthy volunteers, whose mean body mass index was 27.4. Each person ate every variety once and drank glucose on three separate days.
| Date variety | Grams eaten in the test | GI | Band |
|---|---|---|---|
| Bo ma'an | 72.7 | 46.3 | Low |
| Dabbas | 76.2 | 49.1 | Low |
| Lulu | 73.6 | 53.5 | Low |
| Fara'd | 72.5 | 54.0 | Low |
| Khalas | 72.6 | 55.1 | Borderline |
Khalas, at 55.1, sits just above the low band's cut-off of 55 and below the medium band's start at 56, so it is marked borderline here. The paper does not give a glycemic load for the dates, so there is no GL column.
None of the three studies tested Mariami, the dark, semi-dry, chewy date from Iran that this site is named after. No GI figure for it appears on this page.
Reading the three charts together
The three studies used different volunteers and measured blood glucose in different ways. The dates study used finger-prick capillary blood, while the other two used venous blood. The dessert volunteers had a mean age of 31.8 and a mean BMI of 20.9, and the juice group a median BMI of 21.5. The dates group was older, with a mean age of 40.2, and heavier. Within one chart the rows are fair to compare. Across charts the comparison is rough.
One thing does carry across. In every chart the 50 g carbohydrate dose came in a very different weight or volume of food: about 73 to 76 g of dates, 67 to 192 g of dessert, and roughly 394 to 562 mL of juice.
For GI values of rice plates and sugars from Malaysian studies, see the glycemic index meals chart. Grades and pack sizes for the date this site is named after are on the Mariami price page, and more about the site is on the About us page.
These are food-science measurements, not advice for any condition. Anyone managing a health condition should ask a doctor or dietitian how these foods fit their own meals.